Data design through algorithms.
Without proper instruction, these images just look "pretty." I mean, at least I think they do. However, the prettiness is just a pleasant symptom of the mathematical process in which these network maps were made. (you see what I did, switch the names from 'images' to 'network maps') Well, that's because it is what they really are.
Every single color, every single line, every single node and the seemingly empty space between it all is of statistical significance.
All this is made possible by the work of very very smart people. Ha, yeah right, I could never come up with this stuff on my own. I used algorithms that were developed by mathematicians, sociologists, epidemiologists, and even economists. Now, thanks to immense access to information and robust computing power, one individual can accomplish what took these scientists decades to create.
These data visualizations are used to pinpoint demographic and target audiances with empriacally based reasoning.
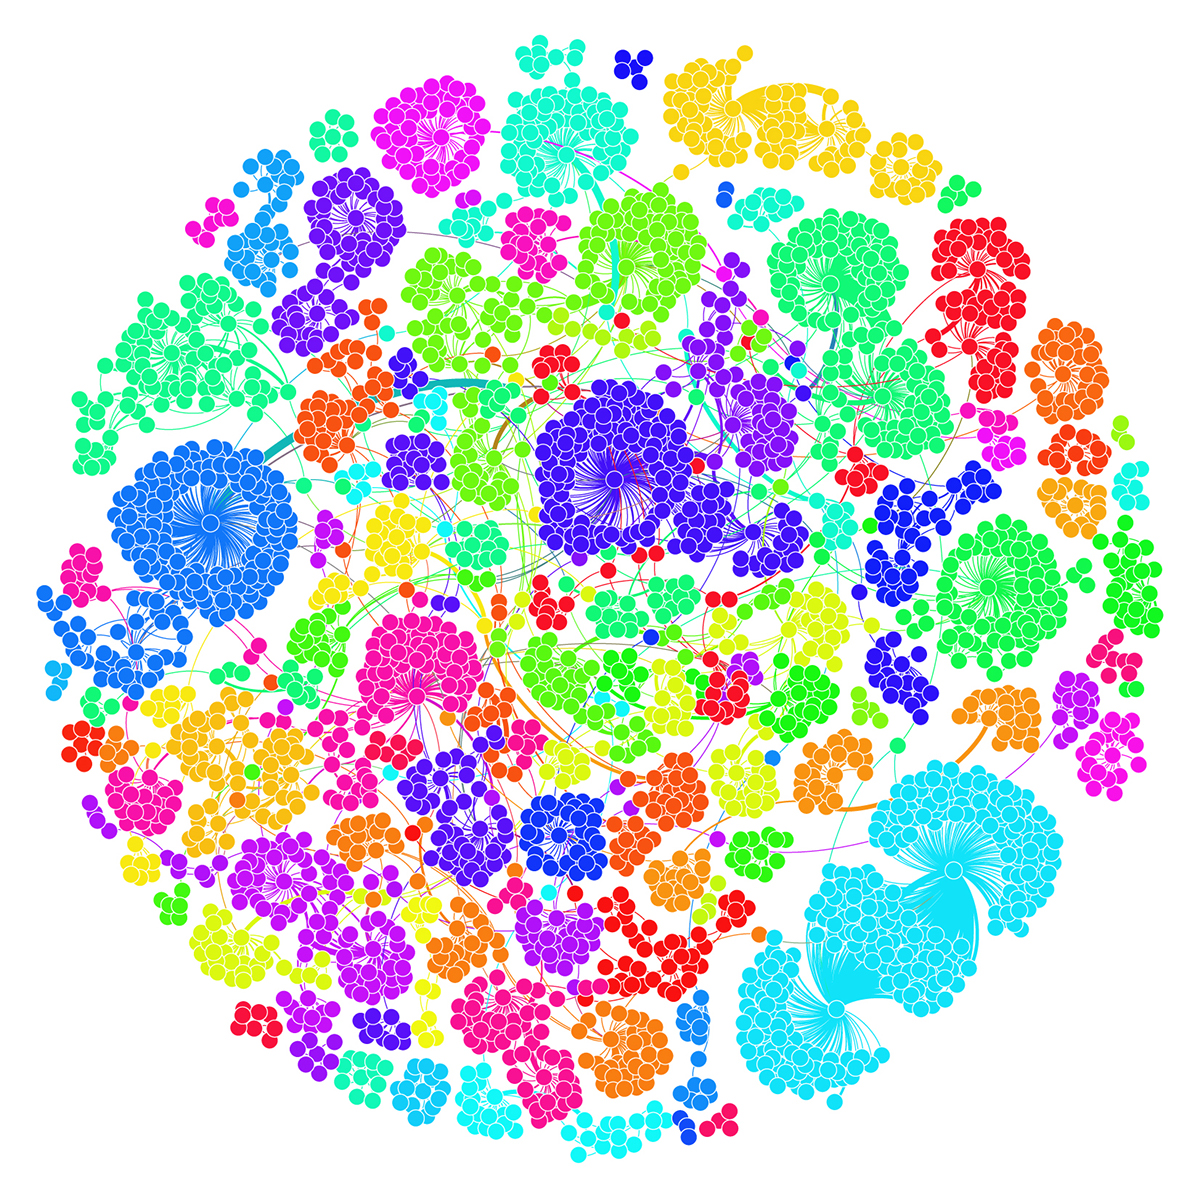
Below are two examples. The first one is of my own Facebook profile data. To my amzement, the algorithmic shaping process was able to paint a very clear picture of the way I actually view my friends. Each cluster was identified and colored through the Modularity Class Module. It identifies the "clusters within clusters." Without any information about our age or graduation year, it seperated us almost exacly by grade and social
aa

Above, is a visualization of my HighSchool Alumni network. I tapped into the Facebook API, and was able to retrive an JSON, GML, XML and CSV format containing an eerie amout of personal infomration. (by the way, everything I did was 100% cool and I abide all personal privacy rules because I wouldn't want someone doing it to me and my data).
To my amazement, the algorithmic shaping process was able to paint a very clear picture of my early highschool days. Each cluster was identified and colored through the Modularity Class module developed by a team of Cornell physicists.
It defines the "clusters within clusters." Without any information about our age or graduation year, it separated us almost exactly by grade and with creepy accuracy of clumping the popular kids together.
Okay, I'm getting tired of typing, so here is a description in 5 lines or less:
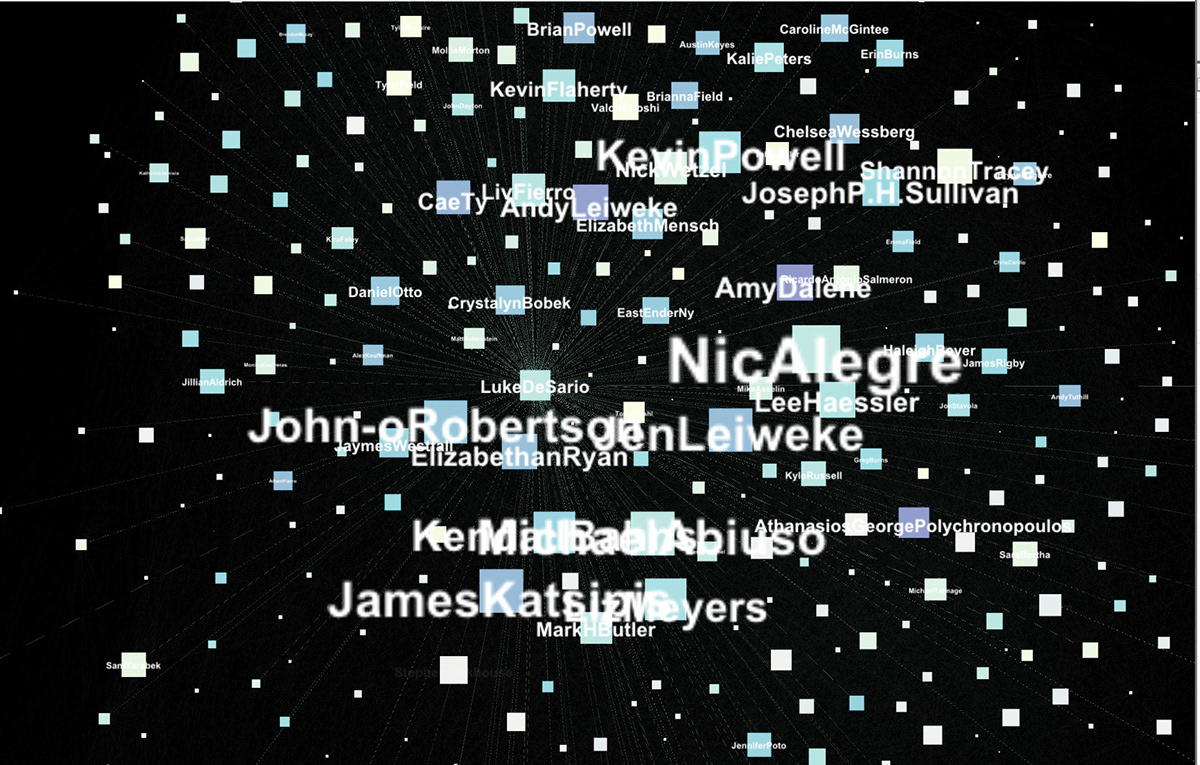
Above is a network linking authors of journal articles to the citations the used in their papers. All the authors are all faculty at the Columbia University's Department of Epidemiology. This is about 1 year of journal articles.
(3 lines);

This graph is both self evident and super cryptic at the same time. There is no way I could explain it in 4 lines or less, however, like to give an idea of what it is. It's basically how close everyone is together measured by comparing their connections.
I just love the way theI just love the way the data looks while it's going through the calculations. ( the song is from this great great French lab or something called DarwinTunes.org

Here is just an example of how you can really pinpoint people. This is an example of the Ego ID radial partitioning.